Durham, NC, Oct. 23, 2024 (GLOBE NEWSWIRE) — The 2024 Species Protection Report highlights major successes but also substantial remaining gaps in the protection of species in the past 10 years. The report features global and national results of the Species Protection Index for land and sea and draws attention to species and regions most in need of additional conservation action.
Durham, NC, (October 23, 2024) During the first week of the United Nations Biodiversity Conference (COP16), currently taking place in Cali, Colombia, a key topic of discussion among the almost 200 Parties and countless observers has been how to track national progress toward each of the 23 Targets and 4 Goals of the Kunming-Montreal Global Biodiversity Framework (GBF). Metrics for monitoring and evaluating Target 3, also known as “30 x 30,” will likely receive particular attention. Target 3 calls for at least 30 percent of terrestrial, inland water, and coastal and marine areas to be effectively conserved and managed by the year 2030.
In support of Target 3, the E.O. Wilson Biodiversity Foundation’s Half-Earth Project, in collaboration with the Map of Life (MOL), the Group on Earth Observations Biodiversity Observation Network (GEO BON), and Esri are announcing the launch of the first annual Species Protection Report.This report addresses the state of species protection in 2024. It reports on the progress of regions and countries on the adequate representation of species within networks of protected and conserved areas. These trends are measured through the Species Protection Index (SPI), the only formally adopted indicator for Target 3 that directly and quantitatively addresses the importance protected areas play for conserving species. Based on tens of thousands of detailed spatial species data, the index measures, for any region, how well existing conservation areas include areas of biodiversity importance and contribute to species survival and ecological representation.
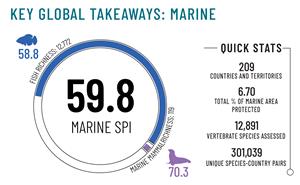
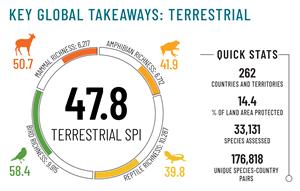
In 2024, global terrestrial SPI reached a score of 48 out of 100, meaning that on average, the assessed terrestrial species have achieved about half of their protection goals. Global marine SPI has advanced farther, reaching a score of 60. Terrestrial protected networks cover 14.4 percent of the total global land area while marine protected networks cover 6.7 percent of the oceans. In the past 10 years, progress in species protection has been faster in the seas than on land and more more efficient with regards to the proportion of additional area protected: terrestrial SPI has increased by 4 points with the additional protection of 2 percent of land area, while marine SPI has increased by 17 points with the additional protection of 4 percent of ocean area.
As part of the Half-Earth Project, the Species Protection Report will be published annually to reflect updates in SPI values globally, celebrate conservation successes within the previous year, and highlight new additions to the SPI workflow. This annual frequency will support global monitoring of trends in SPI values over time, allowing for more targeted efforts in regions and species with remaining gaps and increased recognition of countries and organizations driving positive impact in global species conservation.
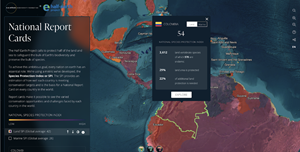
For a more interactive experience, national SPI values can currently be viewed on the Half-Earth Project Map. Through the Half-Earth Project Map, users can explore trends in SPI vs. protected areas (PAs) and other effective area-based conservation measures (OECMs) coverage over time, look-up species-level protection scores, and compare a range of features such as country, taxonomic group, and endemicity. Tools such as National Report Cards (NRCs) summarize the SPI and other aspects of conservation efforts at the national level and can be used to explore how indicators can be used to measure conservation needs and progress and to understand the unique challenges faced by each country.
Together the Species Protection Report alongside tools such as the Half-Earth Project Map represent a global collaborative effort in line with those that will be necessary to achieve Target 3 and the ambitions of the GBF. This Target poses a significant challenge at multiple scales. However, it can be met through the support of collaborations that effectively integrate diverse institutional information, ways of knowing, and sources of data into products that are decision-relevant, scientifically rigorous, and accessible at a global scale.
———–
Data Sources: Half-Earth Project Map – E.O. Wilson Biodiversity Foundation (2024), Map of Life – Yale University (2024)
About the Map of Life
In collaboration with data and impact partners worldwide, the Map of Life leverages the latest approaches and technologies to deliver authoritative and detailed information on the distribution of species and their change. Visit https://mol.org/ to learn more.
About the E.O. Wilson Biodiversity Foundation
The E.O. Wilson Biodiversity Foundation’s mission is to reimagine the way we care for our planet. The Foundation’s major initiative, the Half-Earth Project, is working to inspire informed collective action to save the biosphere. Visit www.eowilsonfoundation.org to learn more.
Attachments
- global_marine_graph
- global_terrestrial_graph
- spi_report_14_15
- spi_report_24_25
- National Report Card – Colombia

Niquole Esters
VP, Strategic Engagement
E.O. Wilson Biodiversity Foundation
nesters@eowilsonfoundation.org
global_marine_graph
Marine species have achieved about 60% of protection goals.
global_terrestrial_graph
Terrestrial species have achieved about half of protection goals.
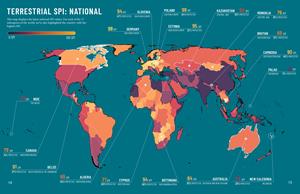
spi_report_14_15
Terrestrial SPI values by sub-region.
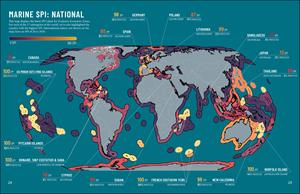
spi_report_24_25
Marine SPI values by subregion.
National Report Card – Colombia
Colombia’s SPI National Report Card.
COMTEX_459056835/2471/2024-10-23T09:00:14
